You are here: Evaluating Data > Understanding the Graph View > Defining a Data Range
Defining a Data Range
There are two options that one can use to define a data range: Hide or Reduce. See below for more information.
Hide Function
Use the Hide data functions on the Edit tab to narrow the data range for the selected data. Unlike rescaling, the selected data is permanently “hidden.” Selecting Unhide All re-displays the hidden data.
To use function, follow the instructions below:
- Click on the desired curve.
- Using the mouse, highlight the data of interested by holding down the mouse button until the range is selected.
- From the Graph > Edit tab or the right-click graph pop-up menu, select from one of the following options:
- Hide selected: Hides the selected data, rescaling the axis if appropriate.
- Hide selected – all: Hides the selected data for all axes, rescaling the axis if appropriate.
- Hide unselected: Hides the data outside of the region of the selected data, rescaling the axis if appropriate.
- Hide unselected – all: Hides the data for all axes outside of the region of the selected data; rescaling the axis if appropriate.
- Hide range: Displays a window to manually enter in the desired data range.
- Unhide All: Re-displays all hidden data.
- NOTE: If there is more than one step displayed and Single Step option is selected, the selected action will apply to all steps.
Alternatively, you can use a Zoom Box to specify the data region. This is a particularly useful method for overlay plots and situations where the desired data is difficult to select:
- Position the cursor in the general area you wish to mark.
- Hold down the left mouse button and drag to create a box. [Draw a box encompassing the desired data region.] Release the mouse when the desired data is selected.
- Move the cursor inside the box and right-click to display the pop-up menu.
- Select the desired Hide function as described above.
Back to top
Reduce Functions
Use the Reduce data functions to narrow the data range for the selected data. Unlike rescaling or hiding, the selected data is removed from the file. However, selecting Reload Data from the spreadsheet reloads the original data (including restoring the removed data).
To use the Reduce function, follow the instructions below:
- Verify your selection of the desired reduction technique from the TRIOS Options > Analysis window.
- If more than one step is displayed on the graph, ensure the Single Step checkbox is checked or unchecked as required. If Single Step is checked, only the selected step will be reduced.
- Click on the desired curve.
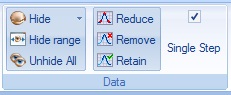
- From the Graph > Edit tab > Data toolbar, select Reduce. A window appears requesting the number of points to Reduce to.
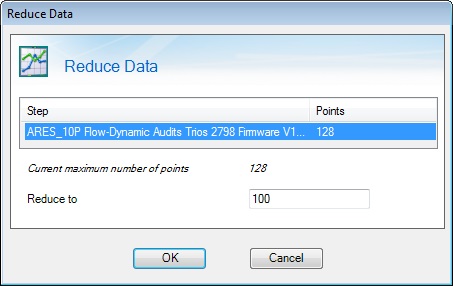
- Enter the number of points to reduce to and click OK.
To use the Remove and Retain functions, follow the instructions below:
- If more than one step is displayed on the graph, ensure the Single Step check box is checked or unchecked as required. If Single Step is checked, only the selected step is reduced.
- Click on the desired curve.
- From the Graph > Edit tab > Data toolbar, select Remove or Retain as appropriate. Remove discards the range selected and keeps all other data; Retain keeps the range selected and discards all other data. A window appears displaying the x-range selected:
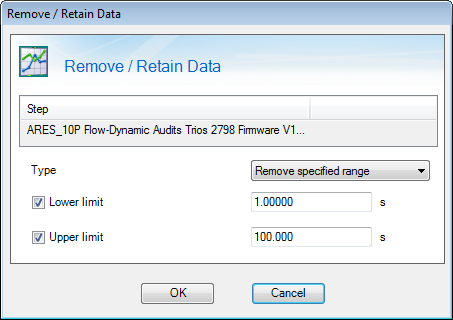
- The x-range may be adjusted by entering new values, if required. Additionally, the x-range lower or upper limits may be disabled completely by unchecking the check boxes, allowing ranges such as >a or <b to be specified. Click OK to proceed with removal.
Back to top
